Lies, Damned Lies, & Statistics
On the safety of cities and self-driving cars
Last week, Gallup put out a poll about how Americans view “safety” in U.S. cities, with its key takeaway being that there were severe partisan differences between which cities were viewed as safe or unsafe. While Democrats (or Democratic-leaning independents) by and large thought cities were safer than their compatriots on the right, the delta between those groups was much severer for cities where certain elements have made a narrative about “crime waves” (say Chicago) than those where they have not (perhaps Miami.)
I’ve taken some of that Gallup data, and transposed it against actual crime data (using City Data’s 2020 metrics, which are a weighted mix of FBI UCR numbers.)
As you can see, many cities of those big “scary” coastal cities that some fear, actually perform rather well in terms of actual reported crimes. Meanwhile, cities in say Texas don’t seem to register as “unsafe” to many, when the actual data shows them to be on the more dangerous side (hint - it’s the guns.)
My point isn’t to make this a political screed, especially given how often crime statistics are misused (keep in mind how different the size and shape of different cities are, versus what people’s mental image is when referring to said cities.) Instead, I’m thinking about how this ties back to curb-centric questions like how do you get workers “back downtown,” how do you get foot traffic and shoppers back into retail districts, how do you get folks comfortable riding transit again…
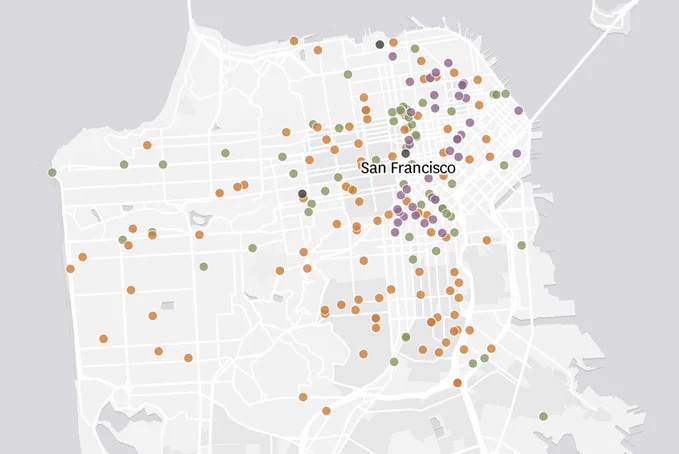
As if one piece of statistical misinterpretation wasn’t enough for the week — another story that’s been making the rounds is worth examining further. The SF Chronicle lit up social media with an article mapping every autonomous vehicle crash in San Francisco.
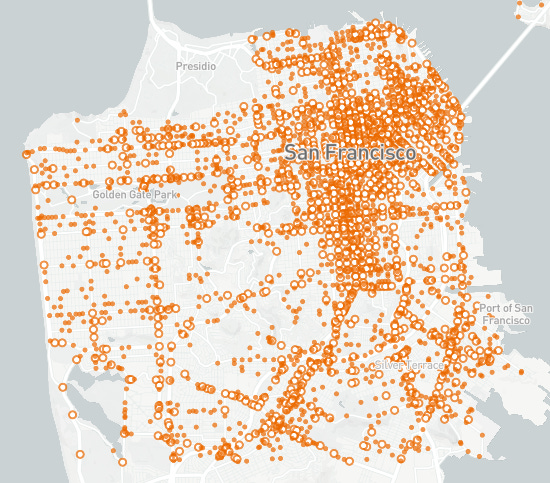
Ooh, dots, scary! But hmm, what happens if you look at say a map of where all car crashes happen? Here’s SF’s “traffic crashes resulting in injuries.”
Or better yet, here’s the Vision Zero High Injury Network, specifically pointing out where pedestrians and bicyclists — our neediest road users — are severely hurt or killed.
And last but not least, here’s SF’s population density (keep in mind that the dense downtown core is also full of office workers that don’t show up here.)
I’m by no means an AV apologist, but it sure looks like that first map is actually just showing us is… where people are or want to be? Where there are busy roads, where there there are poorly designed intersections, where there’s a lot of… everything.
The more robotaxis misbehave, the more they’re making the case to be banished to the suburbs, but there’s no need to essentially hide the denominator if that’s the policy you’re advocating for.
HOT INDUSTRY NEWS & GOSSIP
Hot electric van alert: Mercedes finally put its eSprinter electric van on sale in the U.S., a few years after its European debut. Its ~$72k price point (before rebates) is certainly steeper than competition like the Ford E-Transit, but the Mercedes has double the battery capacity and more cargo area.
Now that’s what I call a curb! Bloomberg Philanthropies is gearing up to announce its next round of Asphalt Art Initiative grant winners. Besides livening up public space, previous projects have resulted in a 50% decrease in crashes involving peds and bikes, plus a 27% improvement to drivers yielding to other road users.
Micromobility is baaaack: New NABSA data shows that shared scooter and bike usage has finally eclipsed its pre-pandemic highs. Operators like Bird may still be struggling to make reliable profits, but even at the increased price per mile often seen these days, a good 157 million trips were taken in North America last year.
Which of these systems gets more ridership?


Well that’s embarrassing… Vancouver’s metro system now gets more ridership (~400k/ weekday) than either Chicago’s or DC’s, despite Chicago’s (left image) being double the size, and Washington’s 2.6X. The two American regions are also each about 3-4x as populous as Greater Vancouver, a relatively dinky part of the PNW. While this might at first make American transit feel like a lost cause, Canada’s strong performance (Toronto and Montreal have even higher ridership) actually suggests a path forward. Canada built this impressive ridership not with huge investments into infrastructure, or wildly different land and automotive patterns, but by funding bus systems that come far more frequently. If there’s one thing America can still maybe do, it’s throw money at a problem!
Delivery roundup: Instacart’s S-1 paperwork has some important lessons regarding shifting consumer behavior. DoorDash unveils AI-enhanced phone ordering. Delivery Hero trims losses, but investors still aren’t happy. Zepto becomes India’s first 2023 unicorn, shows path forward for instant delivery.
What’s in your Wombi? LA, rejoice: the Wombi has landed. The innovative service offers Angelenos $99/mo premium cargo bikes, with delivery, repairs and maintenance included. This model has already moved the needle in Australia, it’ll be great to see what this does for adoption stateside.
Seattle dreamin’: Seattle has unveiled its updated Transportation Plan, the first revision since 2014. The high level vision doc calls for more urban villages, friendlier streets and curbs, plus many more miles of rapid transit.
A few good links: Vote on top climate tech startups — we’re pulling for our friends at it’s electric! Times Square flooding is a good reminder that we can’t sit on infrastructure upgrades. 130 years ago a tamale vendor was robbed in Downtown LA, what’s changed since then? OMF to host USDOT Smart Grant info session. Push back against London’s ULEZ expansion is a good reminder that plenty of Europe has poorly designed suburbia as well.
Until next week!
- Jonah Bliss & The Curbivore Crew


